

-

-
ABOUT DONGFENG
-
SUPPORT & SERVICE
-
NEWS
-
CONTACT US
The 2025 Export Market for the Used Car Industry
Used NEVs are also gaining momentum, fueled by a 40.9% penetration rate in 2024 and growing supply. With evolving consumer mindsets and rising acceptance of used vehicles, the global used car industry is set for continued expansion.
May 27,2025
The 2025 Export Market for the Used Car Industry
Amid the global boom in the automotive industry, the used car market has emerged as a dynamic and increasingly vital sector. Although China’s used car exports only began in 2019, the industry has seen exponential growth. In 2024, export volume reached approximately 400,000 units — a year-on-year increase of 45.7% — with total export value surpassing USD 10 billion. In January 2025 alone, monthly exports hit 81,000 units, with new energy vehicles (NEVs) accounting for over 30% of that figure for the first time. China's used car exports now reach over 160 countries worldwide, and a mature export ecosystem is rapidly taking shape.
However, the development of the global used car market has not been without challenges. Import regulations in key markets continue to exert significant influence on the industry. Russia, for instance, has banned the import of right-hand drive vehicles and restricted imports of cars over five years old. Mexico prohibits the import of vehicles older than ten years. Starting December 2024, Kazakhstan will ban personal imports of vehicles less than three years old. Nigeria, meanwhile, prohibits the import of right-hand drive vehicles and those older than fifteen years. In addition, each country has its own requirements regarding taxes, import documentation, and regulatory compliance, adding further complexity to cross-border trade.
Global Used Car Market Share by Region
- North America (particularly the United States): Holds the largest share of the global used car market, accounting for approximately 35%–40%. Key drivers include a mature automotive finance system, a well-established legal framework, and a high vehicle replacement rate.
- Europe: Represents around 25%–30% of the global market, with Germany, the United Kingdom, and France as leading contributors. The used electric vehicle (EV) market is gradually taking shape.
- Asia-Pacific: The fastest-growing region, led by China, India, and Southeast Asia. In 2024, the Asia-Pacific market accounted for approximately 20%–25% of global share, with expectations for continued expansion.
- Latin America and the Middle East & Africa: Markets remain relatively fragmented but show strong growth potential, driven primarily by price-sensitive consumers and reliance on imported vehicles.
I.Overview of China's Used Car Export Market
1.The Evolution of China’s Used Car Export Industry
Compared with other developed countries, China entered the used car export market relatively late, with official operations beginning only in 2019. On May 5, 2019, the Ministry of Commerce, the Ministry of Public Security, and the General Administration of Customs jointly held a special meeting to formally launch China’s used car export initiative. The first batch of pilot regions included ten provinces and municipalities: Beijing, Tianjin, Shanghai, Zhejiang (Taizhou), Shandong (Jining), Guangdong, Sichuan (Chengdu), Shaanxi (Xi’an), Qingdao, and Xiamen. It wasn’t until March 1, 2024, that used car exports were fully liberalized nationwide.
2.An Overview of China’s Used Car Exports
China’s Used Car Export Scale Continues to Reach New Heights
Since the pilot program was launched in 2019, China’s used car exports have experienced rapid development. In 2024, the export volume reached 400,000 units, a 45.7% year-on-year increase, with export value surpassing USD 10 billion. The growth trend continued in January 2025, with a monthly export volume of 81,000 units. Among these, the proportion of new energy vehicle (NEV) exports exceeded 30%, reflecting a structural upgrade. This growth is attributed to continuous policy support: since March 2024, the nationwide implementation of the used car export qualification application system, combined with the continuation of trade-in policies in 2025, has created a virtuous cycle where “new car exports drive the release of used cars.” Currently, China’s used car exports cover over 160 countries globally, with overseas warehouse networks established in locations such as Dubai and Ghana, signaling a maturing export ecosystem.
New Energy Used Cars Become the Core Driver
In the export structure of 2024, the share of new energy vehicles (NEVs) rose to 58%, with average prices higher than those of fuel-powered cars. More specifically, plug-in hybrid vehicles (PHEVs) have seen remarkable growth, with exports in January 2025 increasing by 170% year-on-year. This has become an effective solution to tackle the European Union’s tariff barriers. Fuel-powered car exports, on the other hand, have maintained their scale through the “zero-mile used car” model (new cars that are registered domestically but not used before being exported), accounting for 42%, with the majority flowing to traditional markets such as Central Asia and Russia.

China’s Used Car Exports by Energy Type in 2024
II.Export Statistics of Major Products in China’s Used Car Industry from 2022 to 2024
(1) Export Statistics of China’s Used Cars (Engine Capacity Over 1000cc but Not Exceeding 1500cc) (HS: 870322) from 2022 to 2024
1.Changes in Total Trade Volume in the Past Three Years
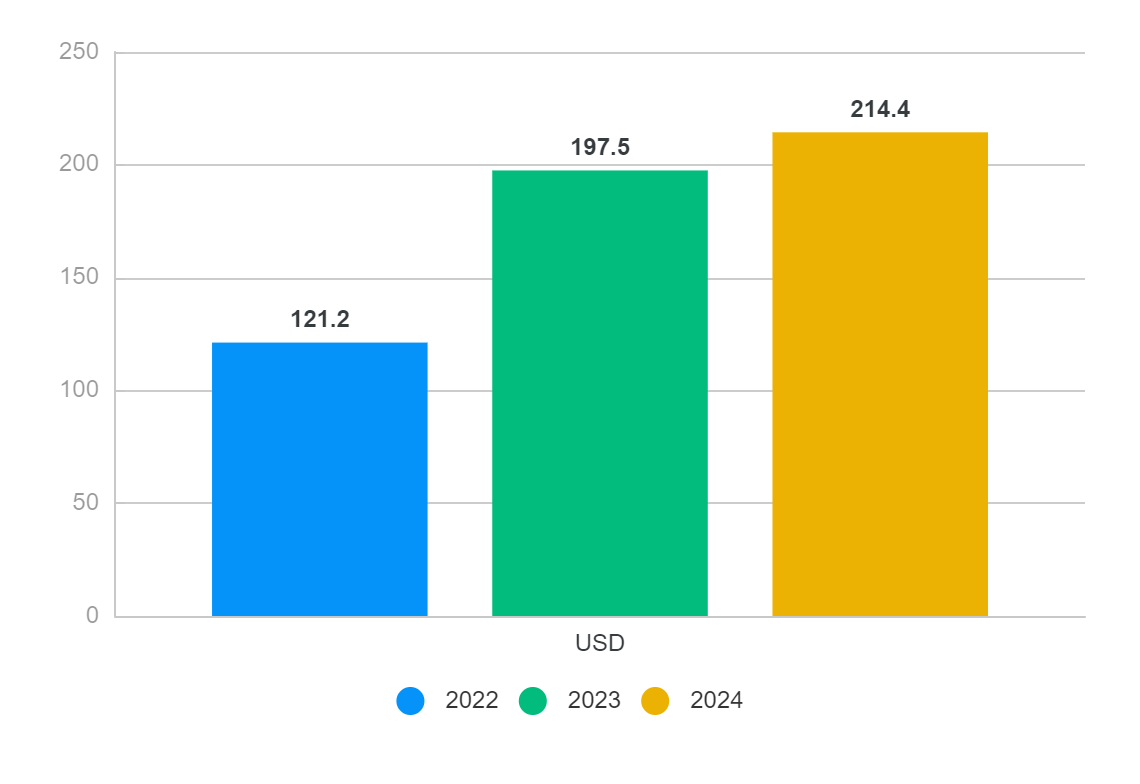
From 2022 to 2024, the total export value of China’s used cars (engine capacity over 1000cc but not exceeding 1500cc) showed an upward trend, increasing from USD 12.12 billion in 2022 to USD 21.44 billion in 2024. The chart below illustrates this trend:
2.Export Destination Analysis for 2024
In 2024, China’s used cars (with engine capacity over 1000cc but not exceeding 1500cc) were primarily exported to regions such as Russia, Mexico, and the United Arab Emirates, which together accounted for 42% of the total export volume. Significant export growth was seen in countries like the UAE and Russia. For details, refer to the chart below:
Export Destination Share of China’s Used Cars (Engine Capacity Over 1000cc but Not Exceeding 1500cc) in 2024
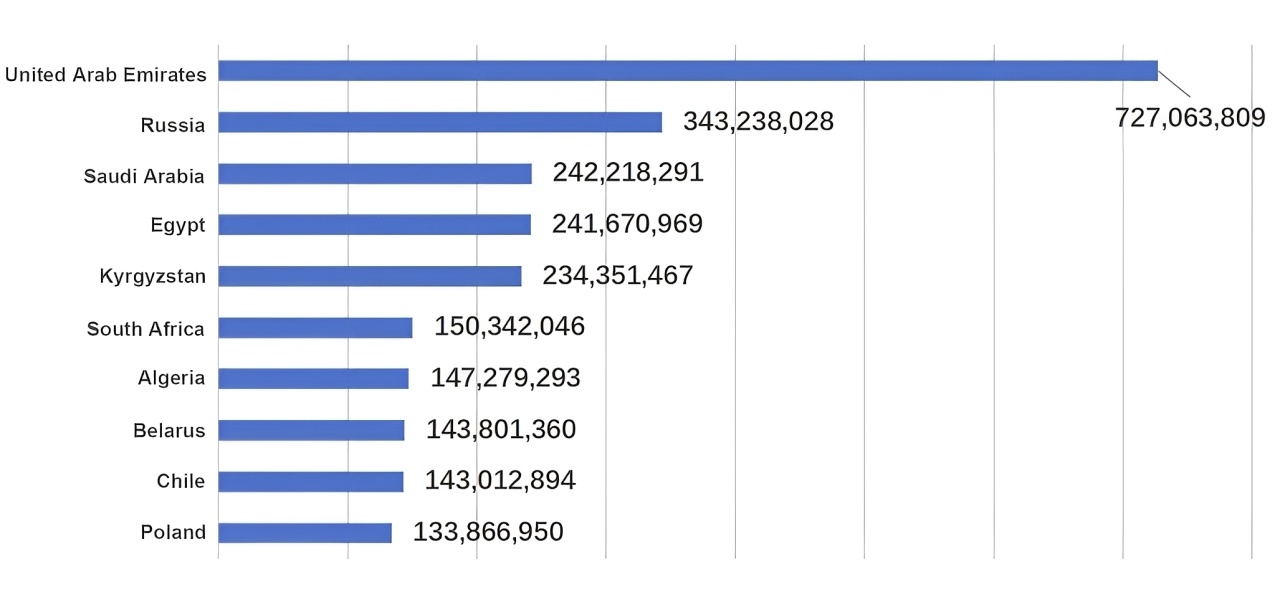
Top 10 Regions by Year-on-Year Export Value Growth of China’s Used Cars (Engine Capacity Over 1000cc but Not Exceeding 1500cc) in 2024 (Unit: USD)
(2) Export Statistics of China’s Used Cars (Engine Capacity Over 1500cc but Not Exceeding 3000cc) (HS: 870323) from 2022 to 2024
1.Changes in Total Trade Value Over the Past Three Years
From 2022 to 2024, the total export value of China’s used cars (with engine capacity over 1500cc but not exceeding 3000cc) showed an upward trend, rising from USD 6.71 billion in 2022 to USD 20.51 billion in 2024. See the chart below for details:

2.Export Destination Analysis for 2024
In 2024, China’s used cars (with engine capacity over 1500cc but not exceeding 3000cc) were mainly exported to regions such as Russia, the United States, and Saudi Arabia, which together accounted for 56% of the total export volume. Among them, exports to Russia showed significant growth, indicating strong purchasing demand. See the chart below for details:

Export Destination Share of China’s Used Cars (Engine Capacity Over 1500cc but Not Exceeding 3000cc) in 2024
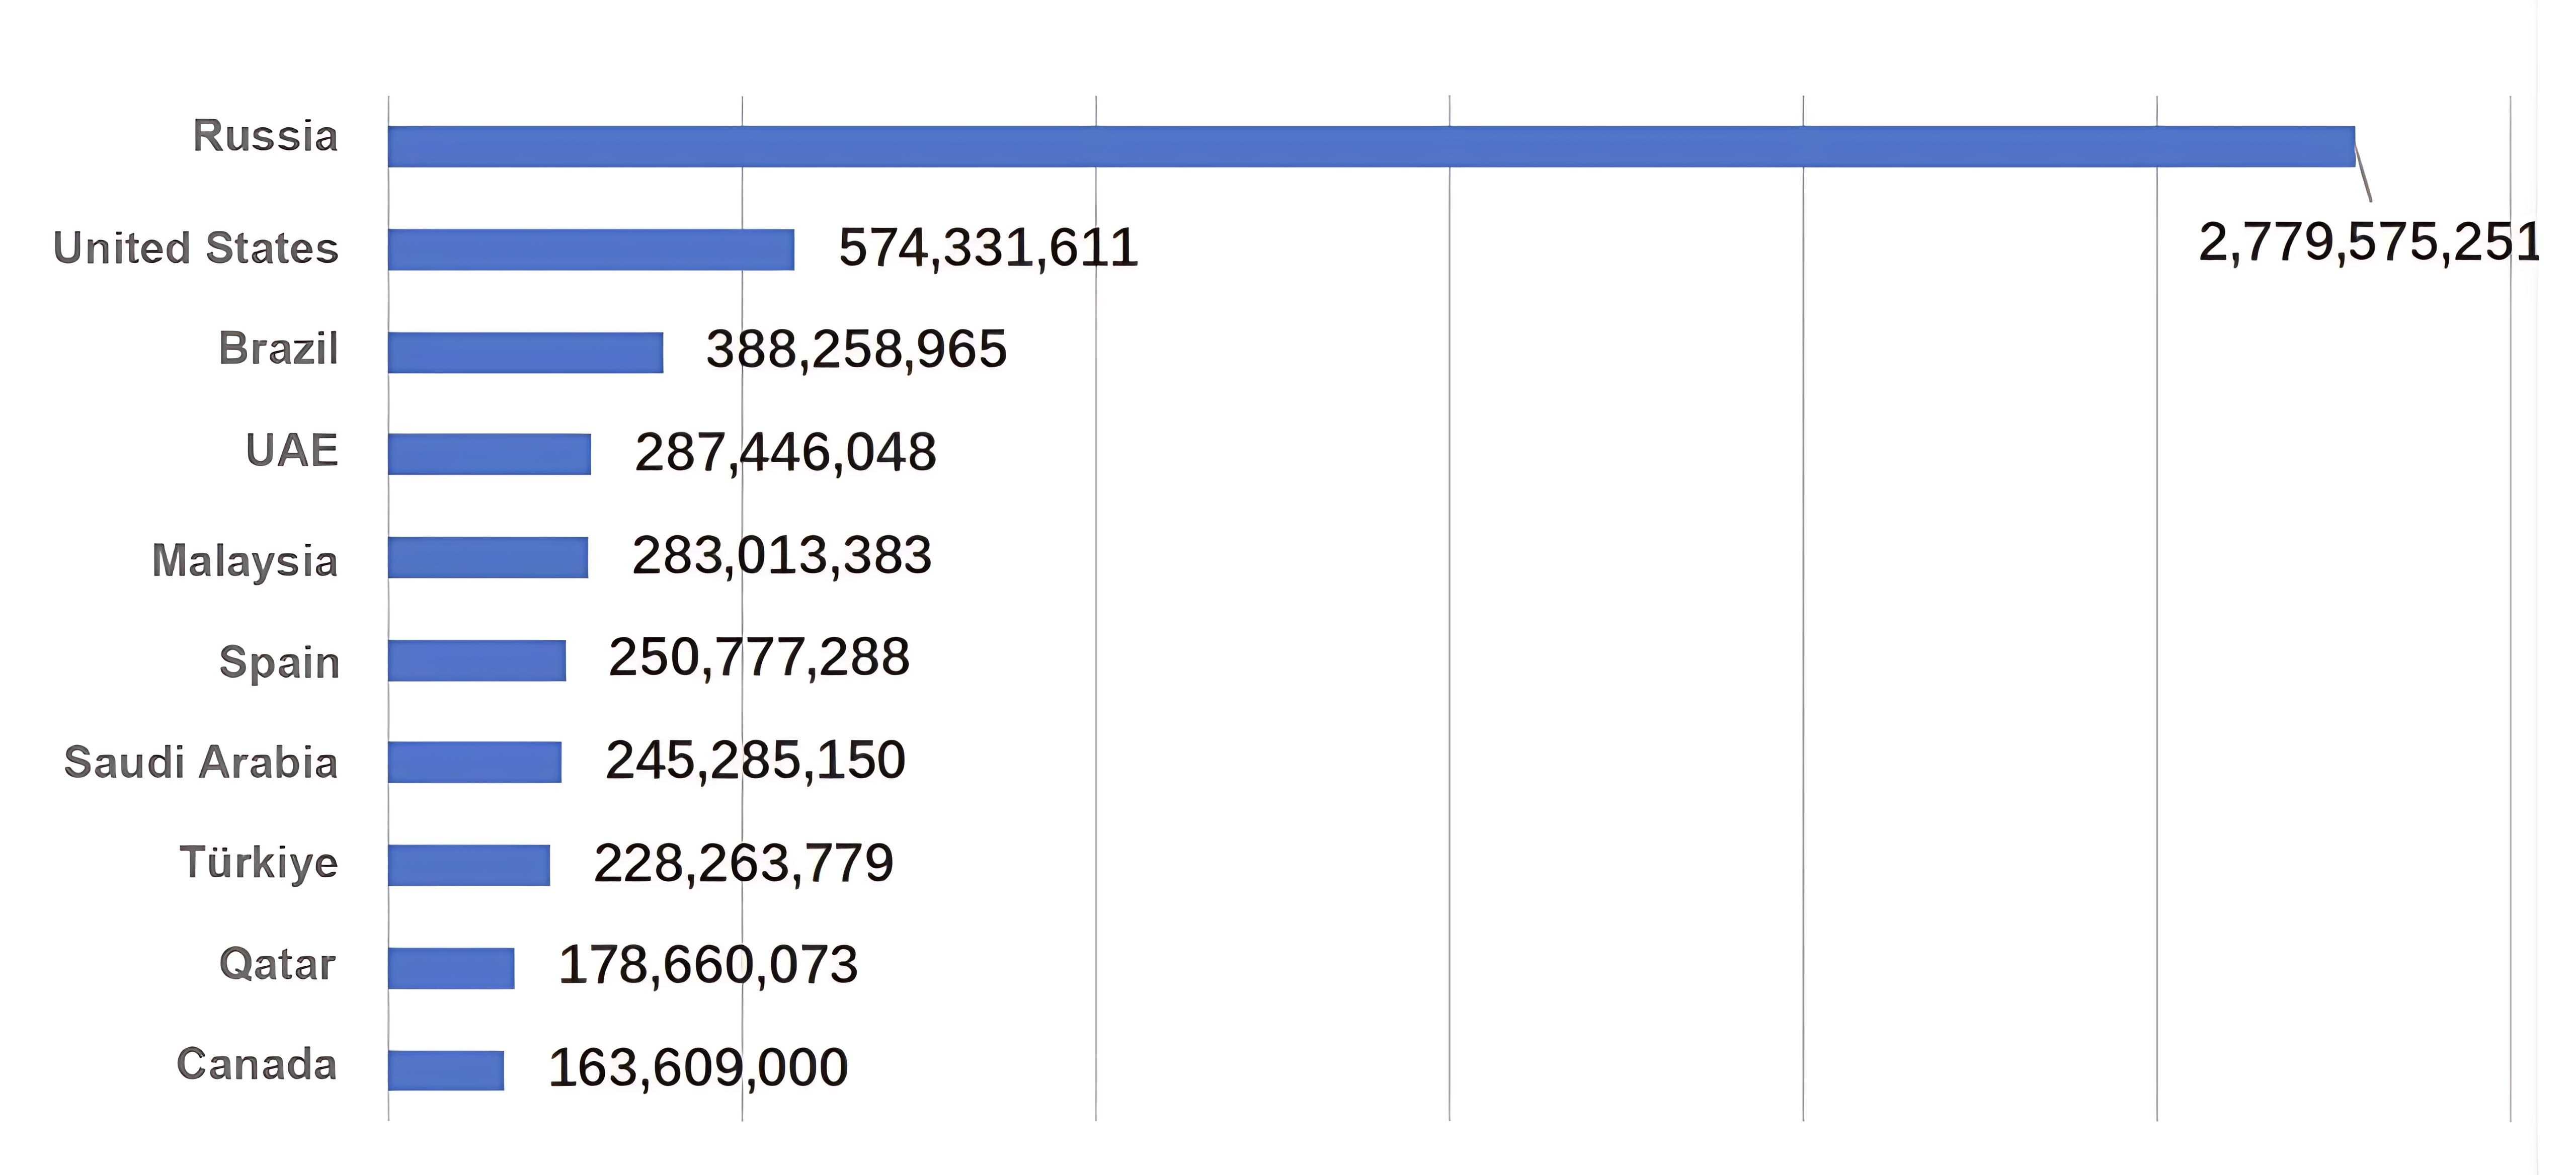
Top 10 Regions by Year-on-Year Export Value Growth of China’s Used Cars (Engine Capacity Over 1500cc but Not Exceeding 3000cc) in 2024 (Unit: USD)
(3) Export Statistics of China’s Lubricating Oil (Excluding Biodiesel) (HS: 27101991) from 2022 to 2024
1. Changes in Total Trade Value Over the Past Three Years
From 2022 to 2024, China’s export value of lubricating oil (excluding biodiesel) increased year by year, surpassing USD 500 million in 2024. See the chart below for details:
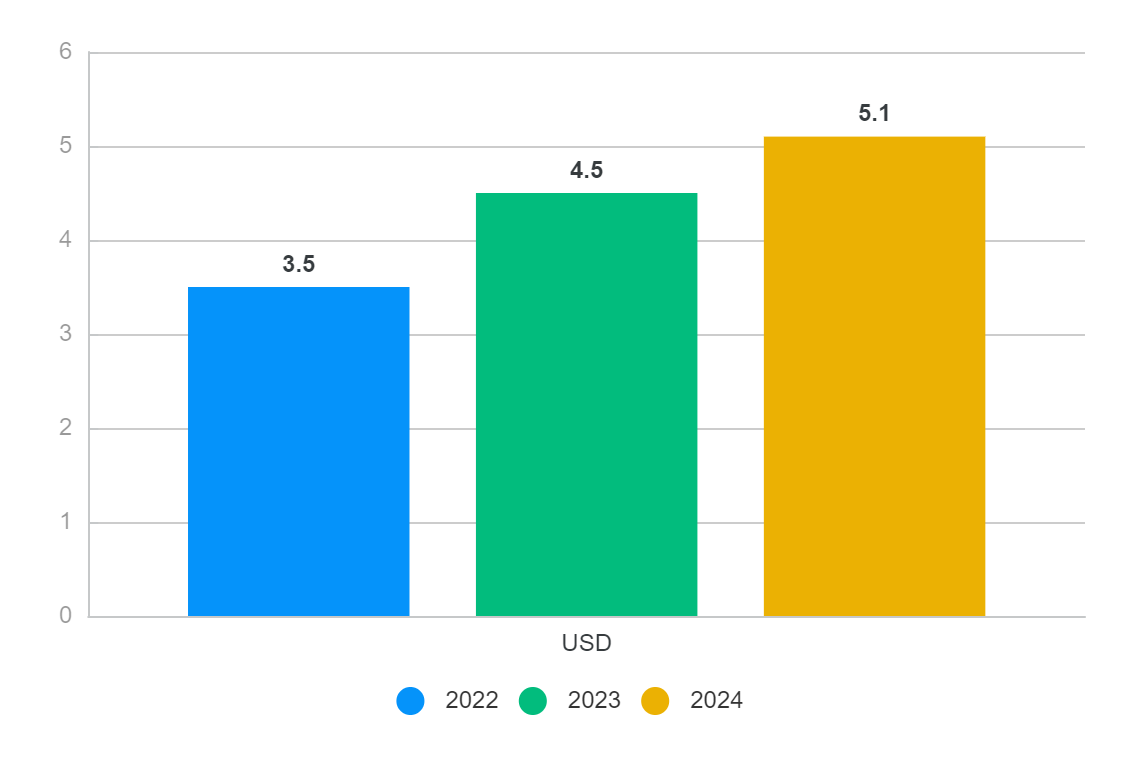
Export Situation of China’s Lubricating Oil (Excluding Biodiesel) from 2022 to 2024 (Unit: USD Billion)
2. Export Destination Analysis for 2024
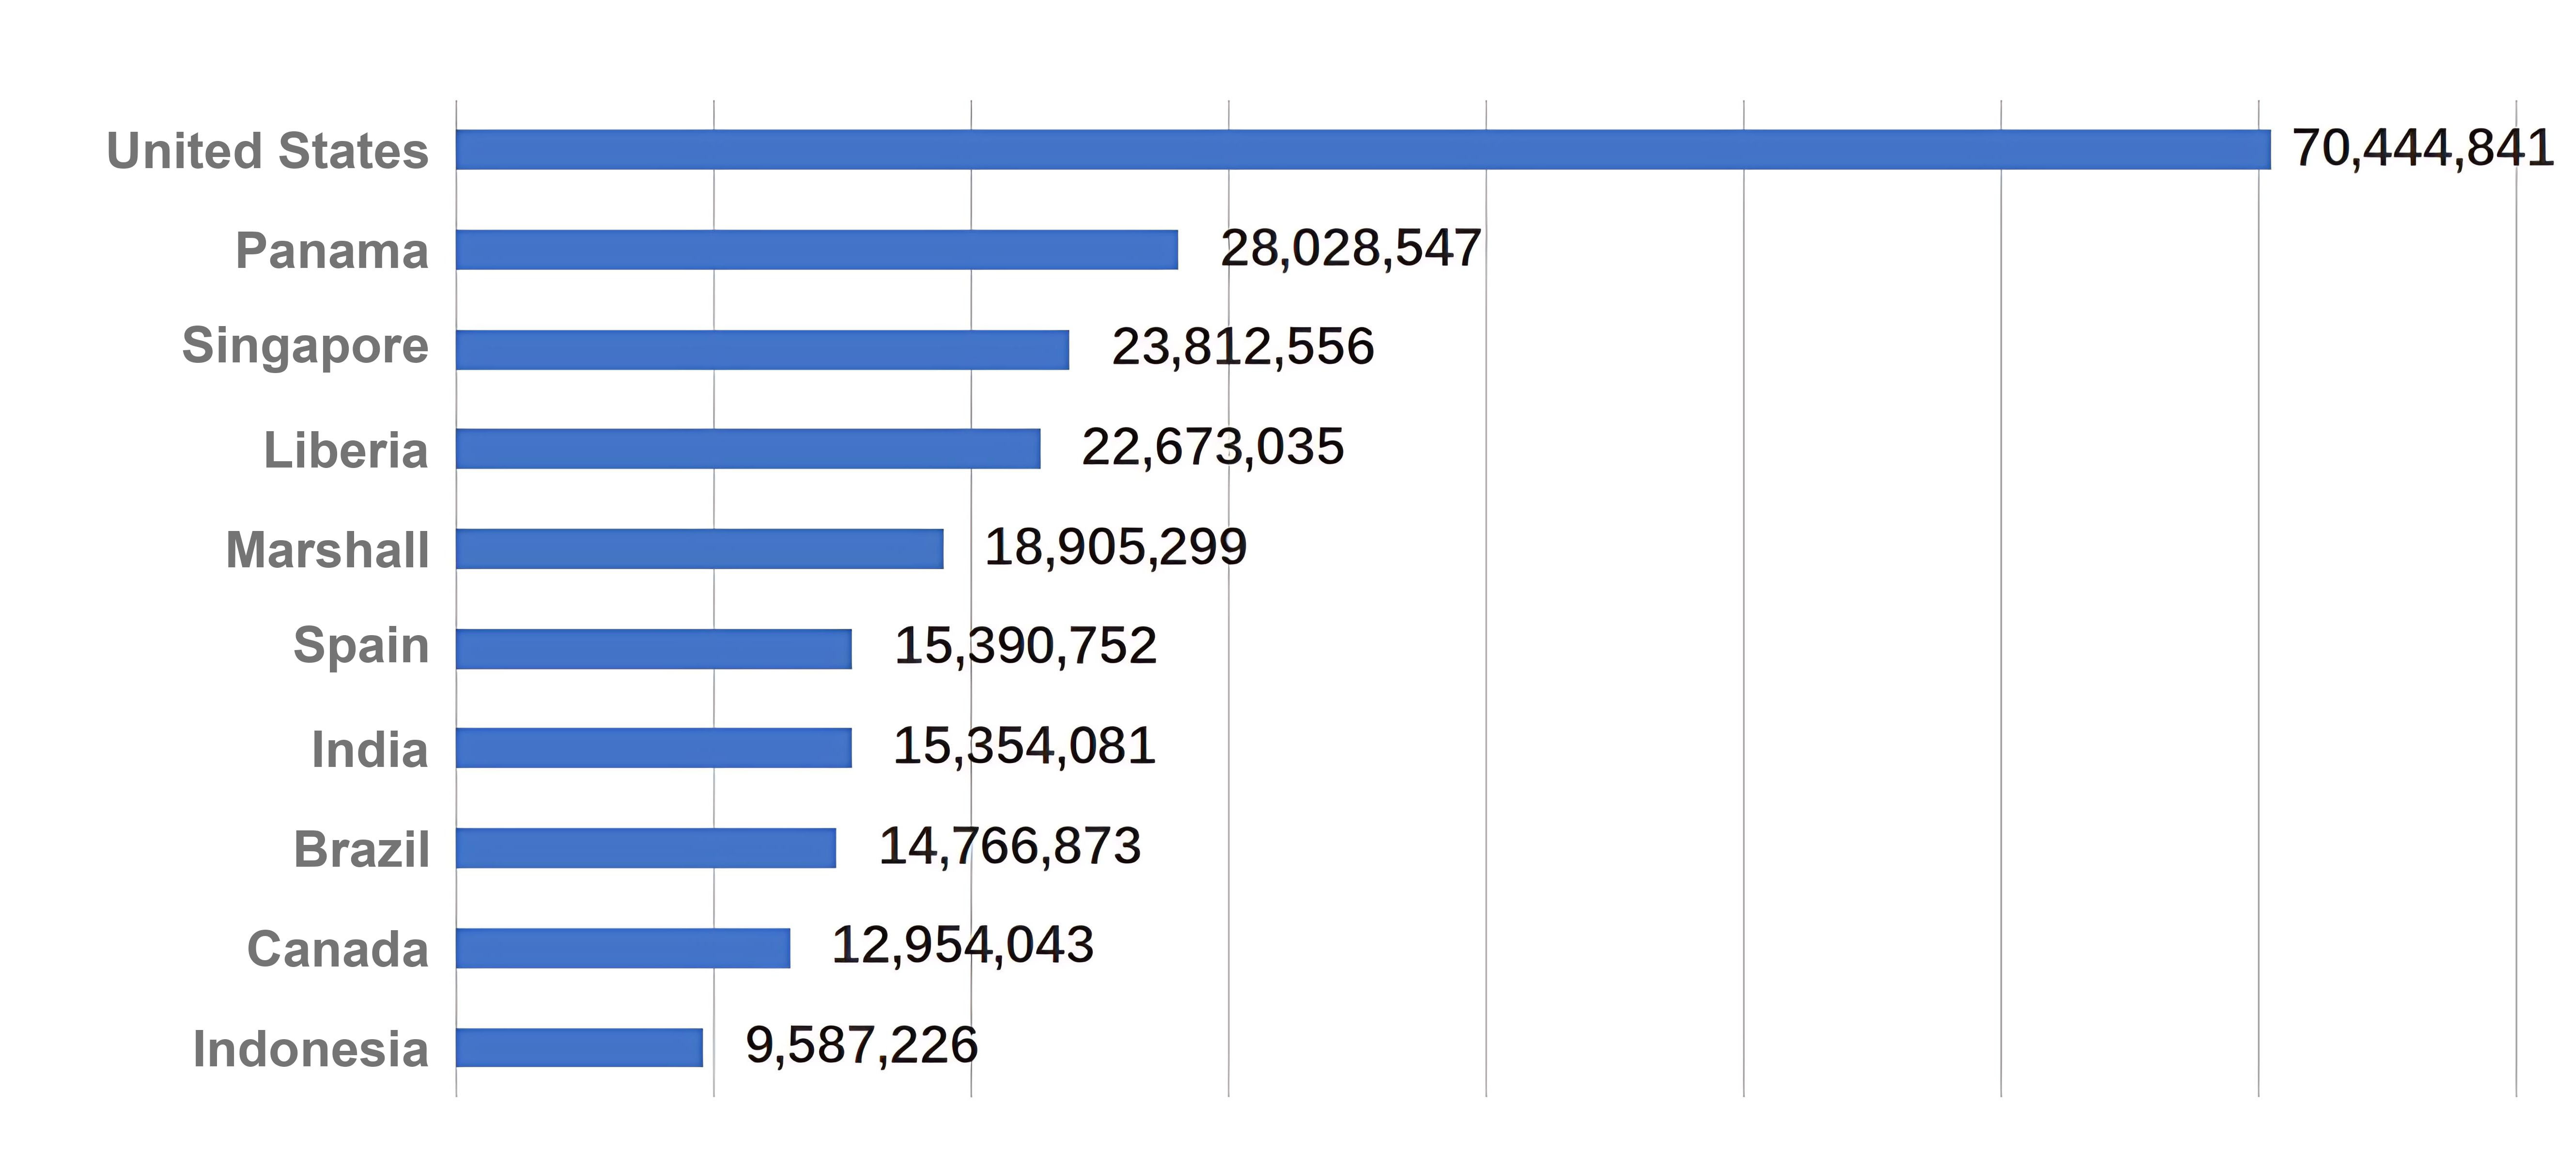
In 2024, lubricating oil (excluding biodiesel) was mainly exported to Panama, Liberia, and Hong Kong SAR, which together accounted for 35% of the total export volume. Liberia showed significant export growth, with a year-on-year increase exceeding USD 10 million. For details, refer to the chart below:

Export Destination Share of China’s Lubricating Oil (Excluding Biodiesel) in 2024
Top 10 Regions by Year-on-Year Export Value Growth of China’s Lubricating Oil (Excluding Biodiesel) in 2024 (Unit: USD)
(4) Export Statistics of China’s Spark Plugs (Specifically or Primarily for Spark-Ignition Internal Combustion Engines) (HS: 840991) from 2022 to 2024
1. Changes in Total Trade Value Over the Past Three Years
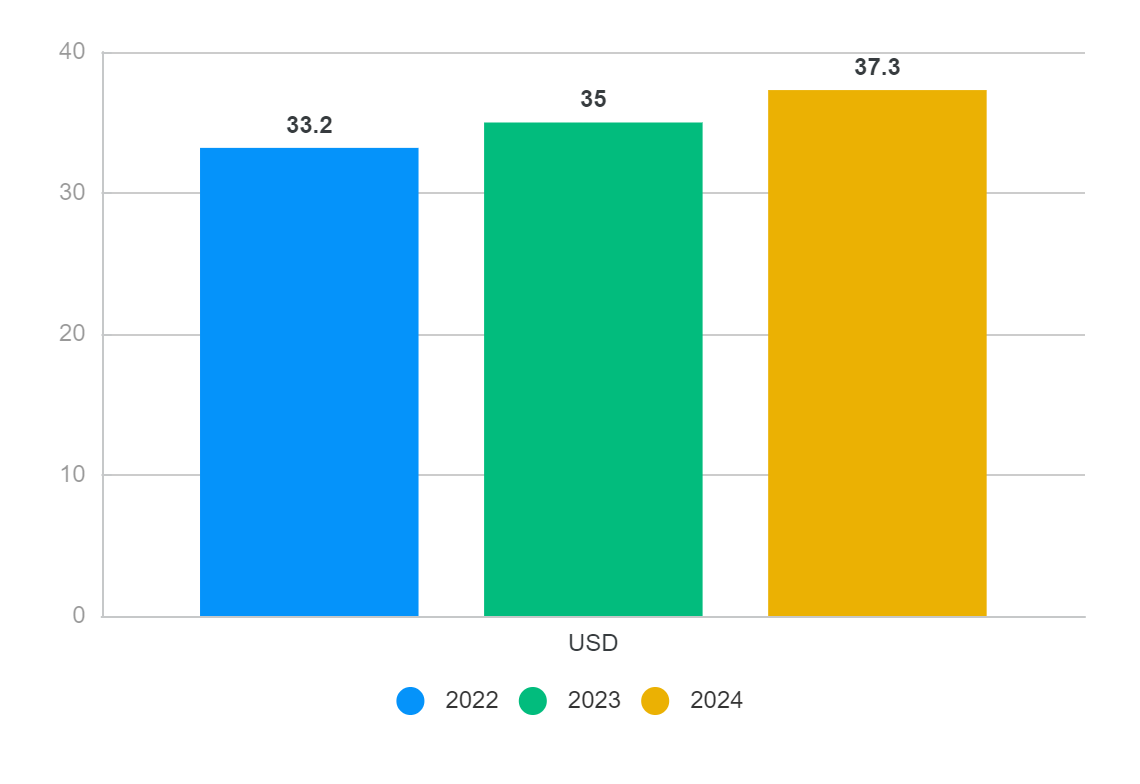
From 2022 to 2024, the total export value of China’s spark plugs (specifically or primarily for spark-ignition internal combustion engines) steadily increased, rising from USD 4.66 billion in 2022 to USD 5.74 billion in 2024. See the chart below for details:
Export Performance of China’s Spark Plugs from 2022 to 2024 (Unit: USD Billion)
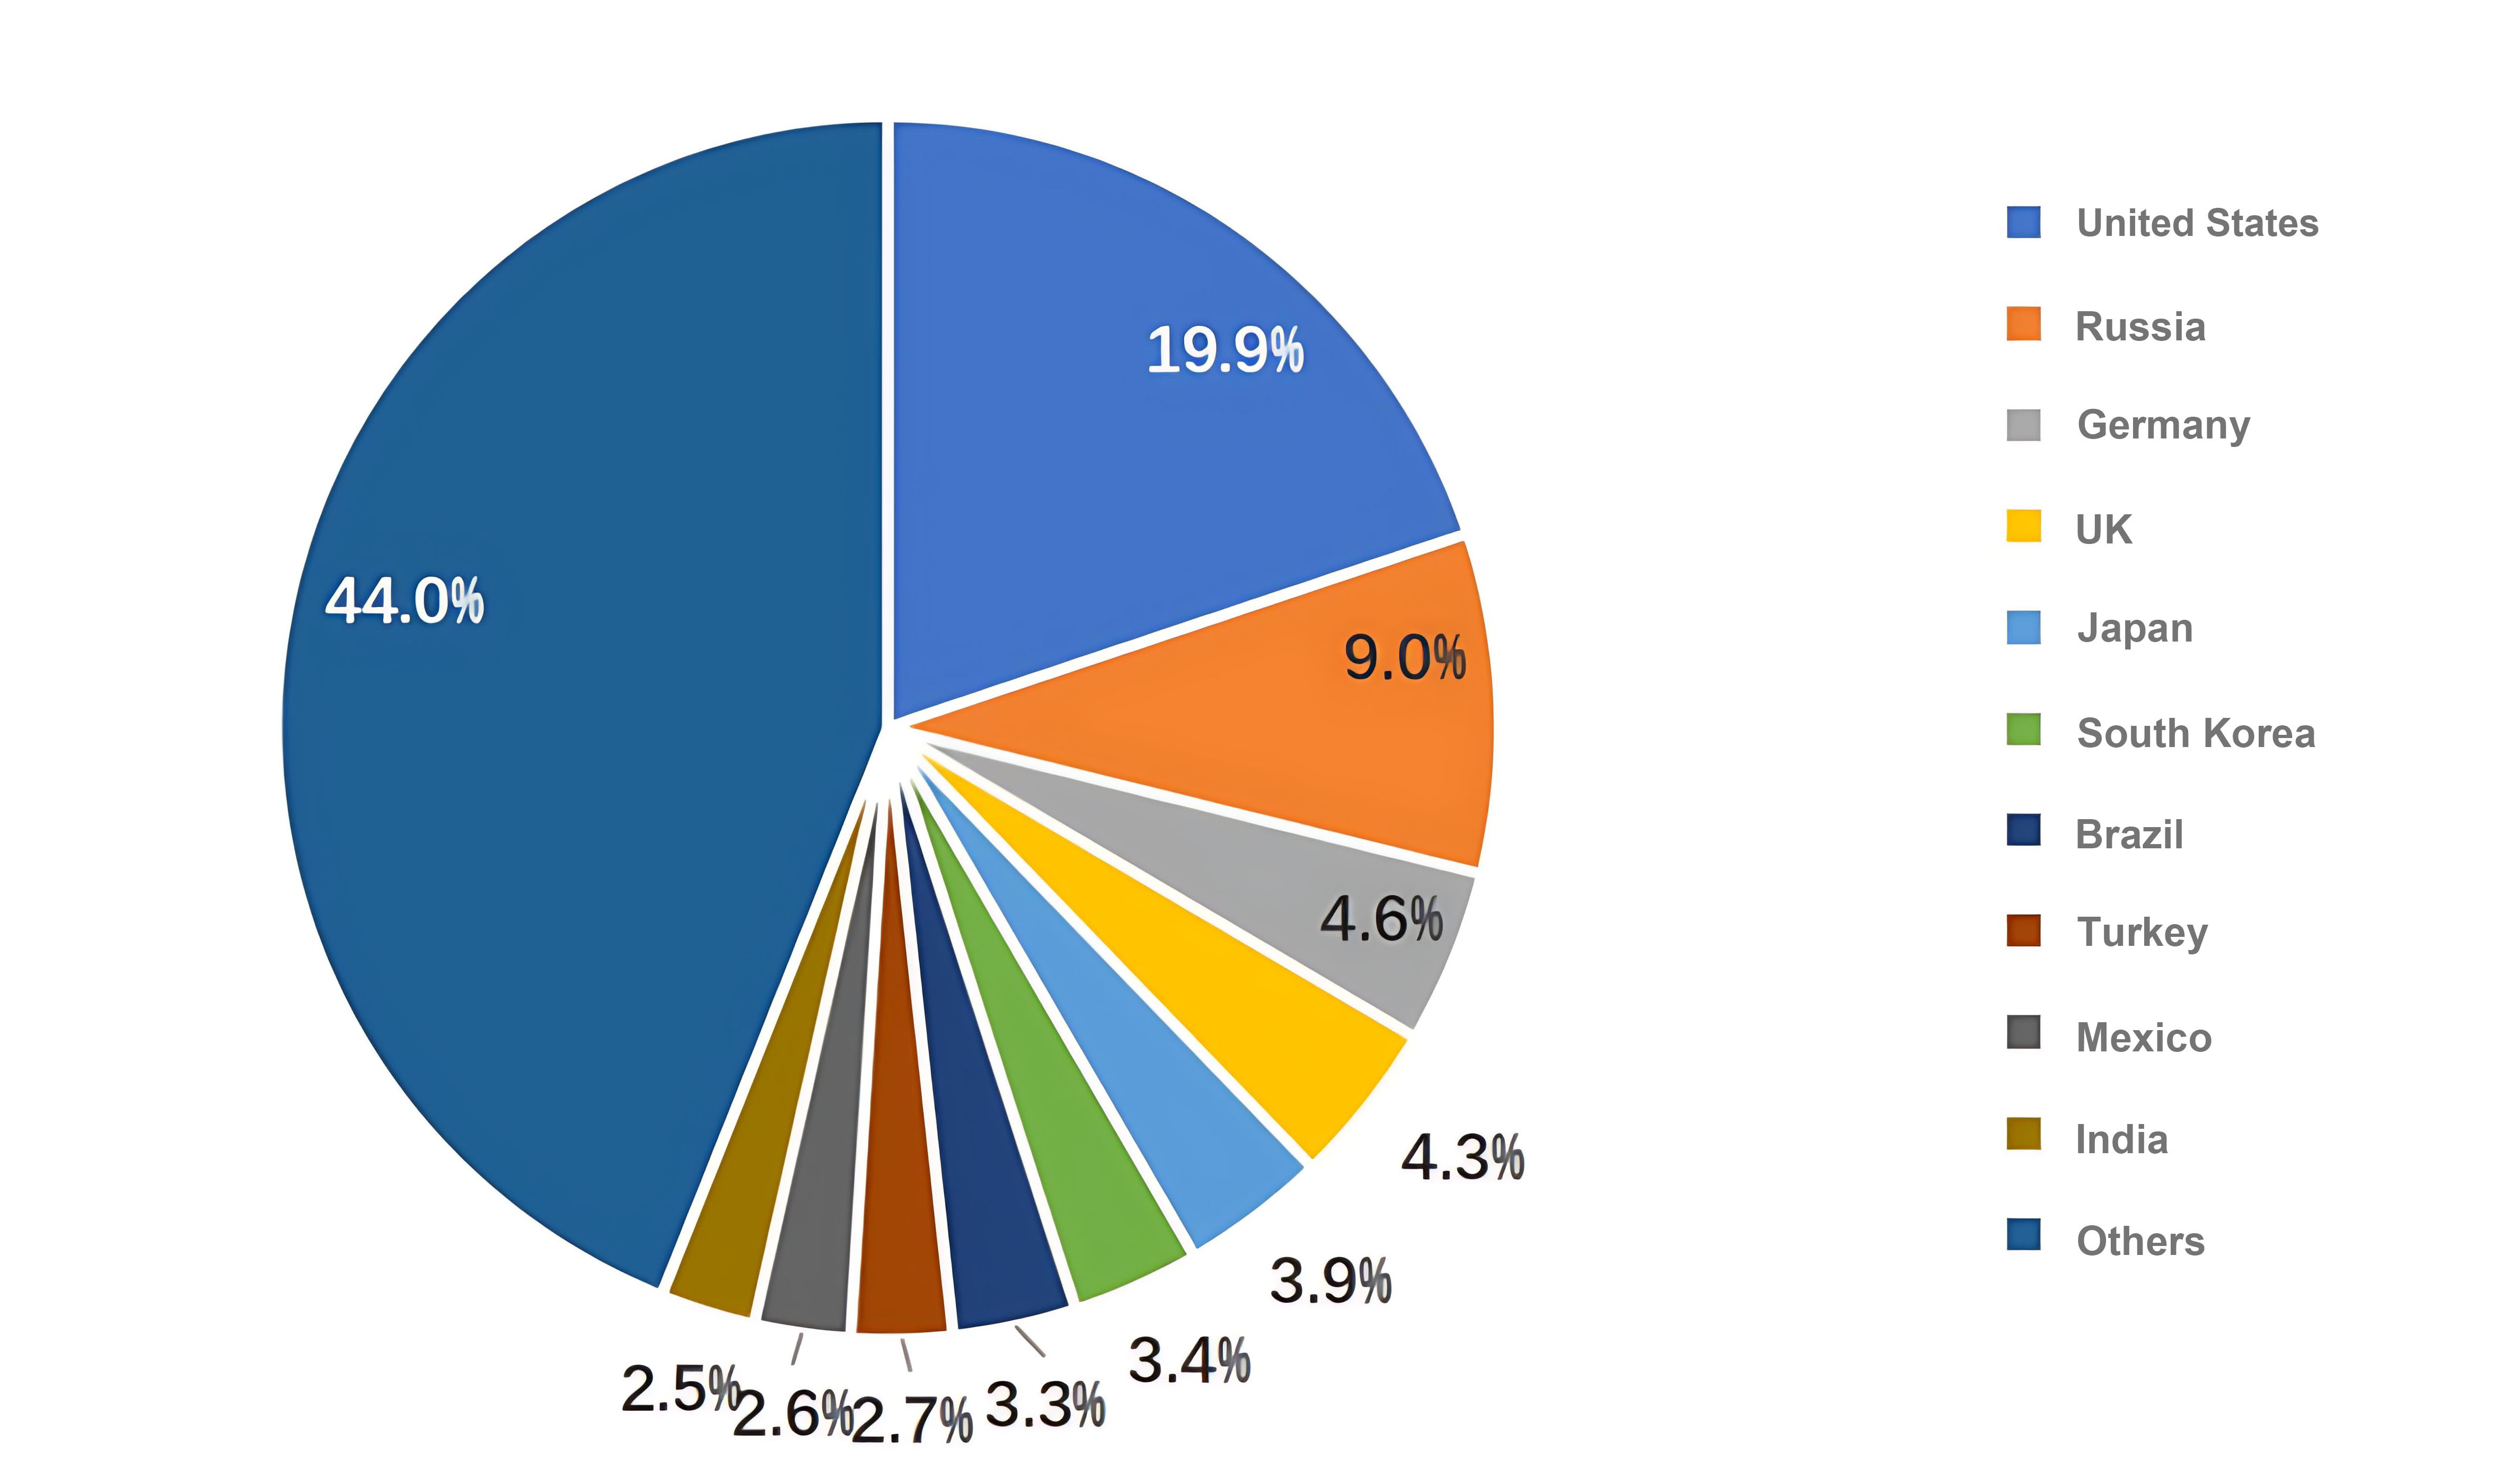
2. Export Destination Analysis for 2024
In 2024, China’s spark plugs were mainly exported to the United States, Mexico, and Japan, which together accounted for 35% of the total export volume. The Netherlands also saw notable export growth, with a year-on-year increase of approximately USD 80 million. See the chart below for details:
Export Destination Share of China’s Spark Plugs in 2024
Top 10 Regions by Year-on-Year Export Value Growth of China’s Spark Plugs in 2024 (Unit: USD)
(5) Export Statistics of China’s Engine and Internal Combustion Piston Engine Parts (Excluding Spark-Ignition Parts) (HS: 840999) from 2022 to 2024
1. Changes in Total Trade Value Over the Past Three Years
From 2022 to 2024, China’s export value of engine and internal combustion piston engine parts (excluding spark-ignition parts) showed a clear upward trend, increasing from USD 3.32 billion in 2022 to USD 3.73 billion in 2024. See the chart below for details:
Export Performance of China’s Engine and Internal Combustion Piston Engine Parts (Excluding Spark-Ignition Parts) from 2022 to 2024 (Unit: USD Billion)
2.Export Destination Analysis for 2024
In 2024, China’s engine and internal combustion piston engine parts were mainly exported to the United States, Russia, and Germany, which together accounted for 33% of the total export volume. Among the regions with notable export growth, the United States is particularly worth noting. See the chart below for details:
Export Destination Share of China’s Engine and Internal Combustion Piston Engine Parts in 2024
Top 10 Regions by Year-on-Year Export Value Growth of China’s Engine and Internal Combustion Piston Engine Parts in 2024 (Unit: USD)
(6) Export Statistics of China’s Rubber Tires (HS: 401290) from 2022 to 2024
1. Changes in Total Trade Value Over the Past Three Years
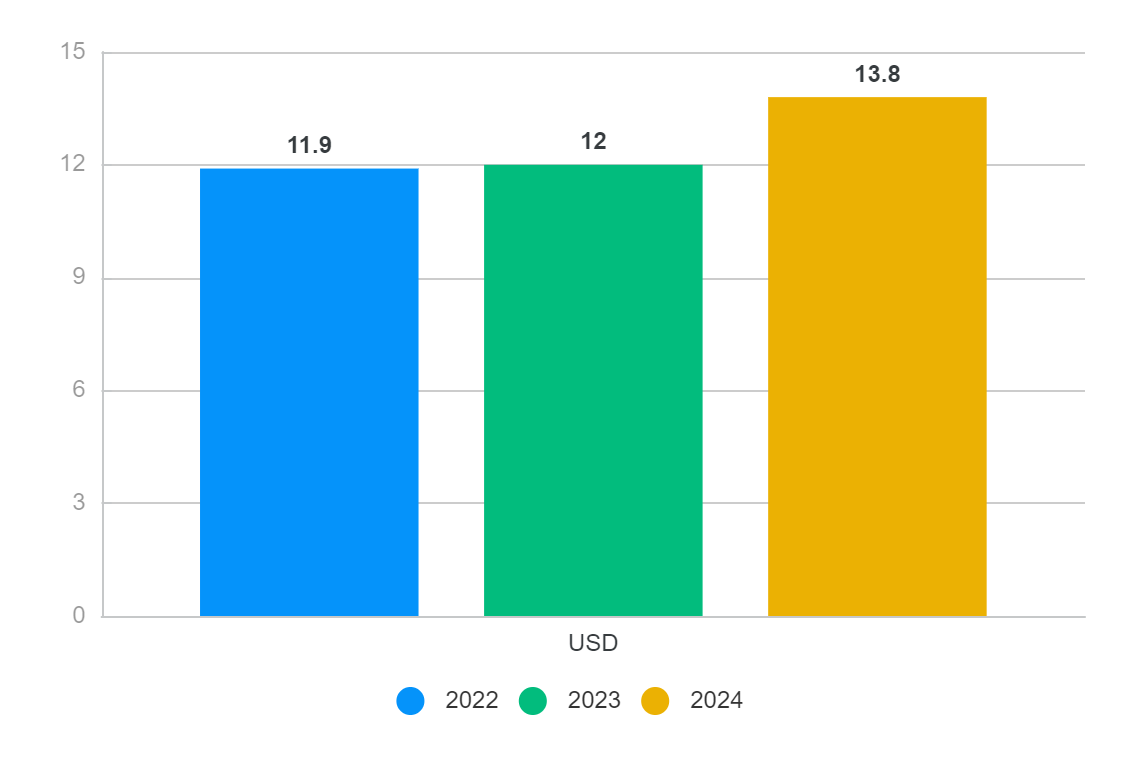
From 2022 to 2024, China’s total export value of rubber tires showed an upward trend, rising from USD 150 million in 2022 to USD 180 million in 2024. See the chart below for details:
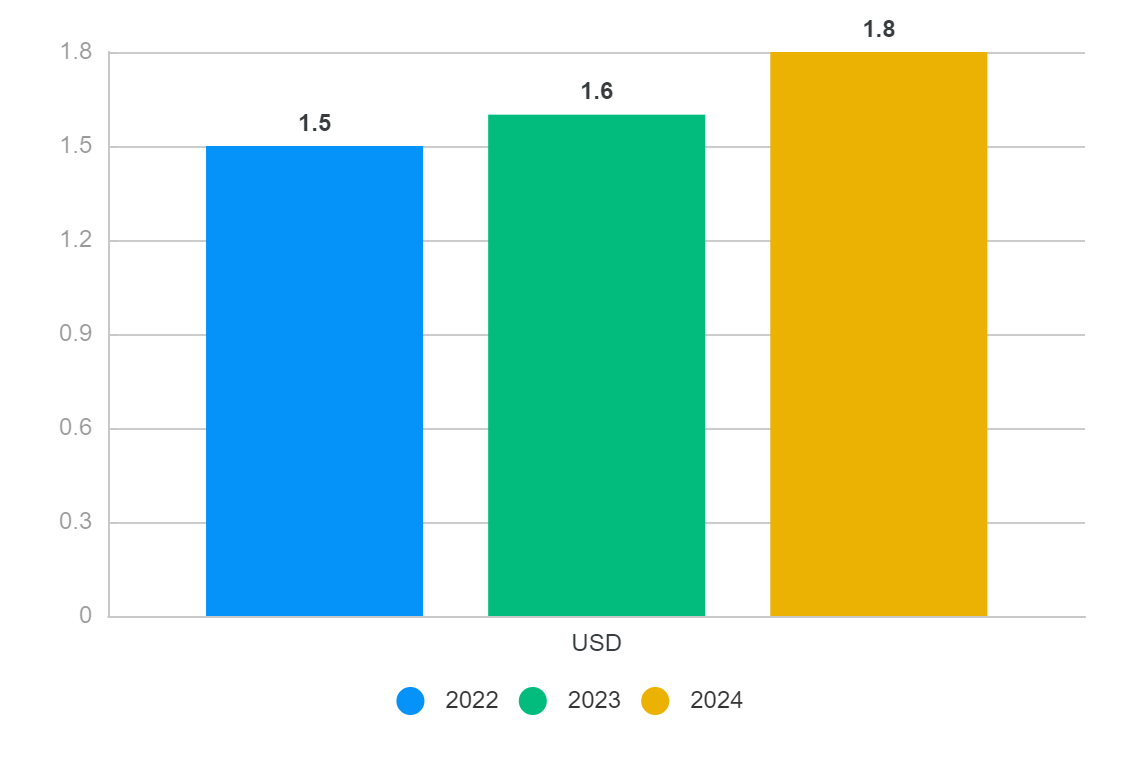
Export Performance of China’s Rubber Tires from 2022 to 2024 (Unit: USD Billion)
2. Export Destination Analysis for 2024
In 2024, China’s rubber tires were mainly exported to the United States, Indonesia, and Russia, which together accounted for 30% of the total export volume. Among the regions with the largest increase in exports, the United States recorded the highest growth. See the chart below for details:
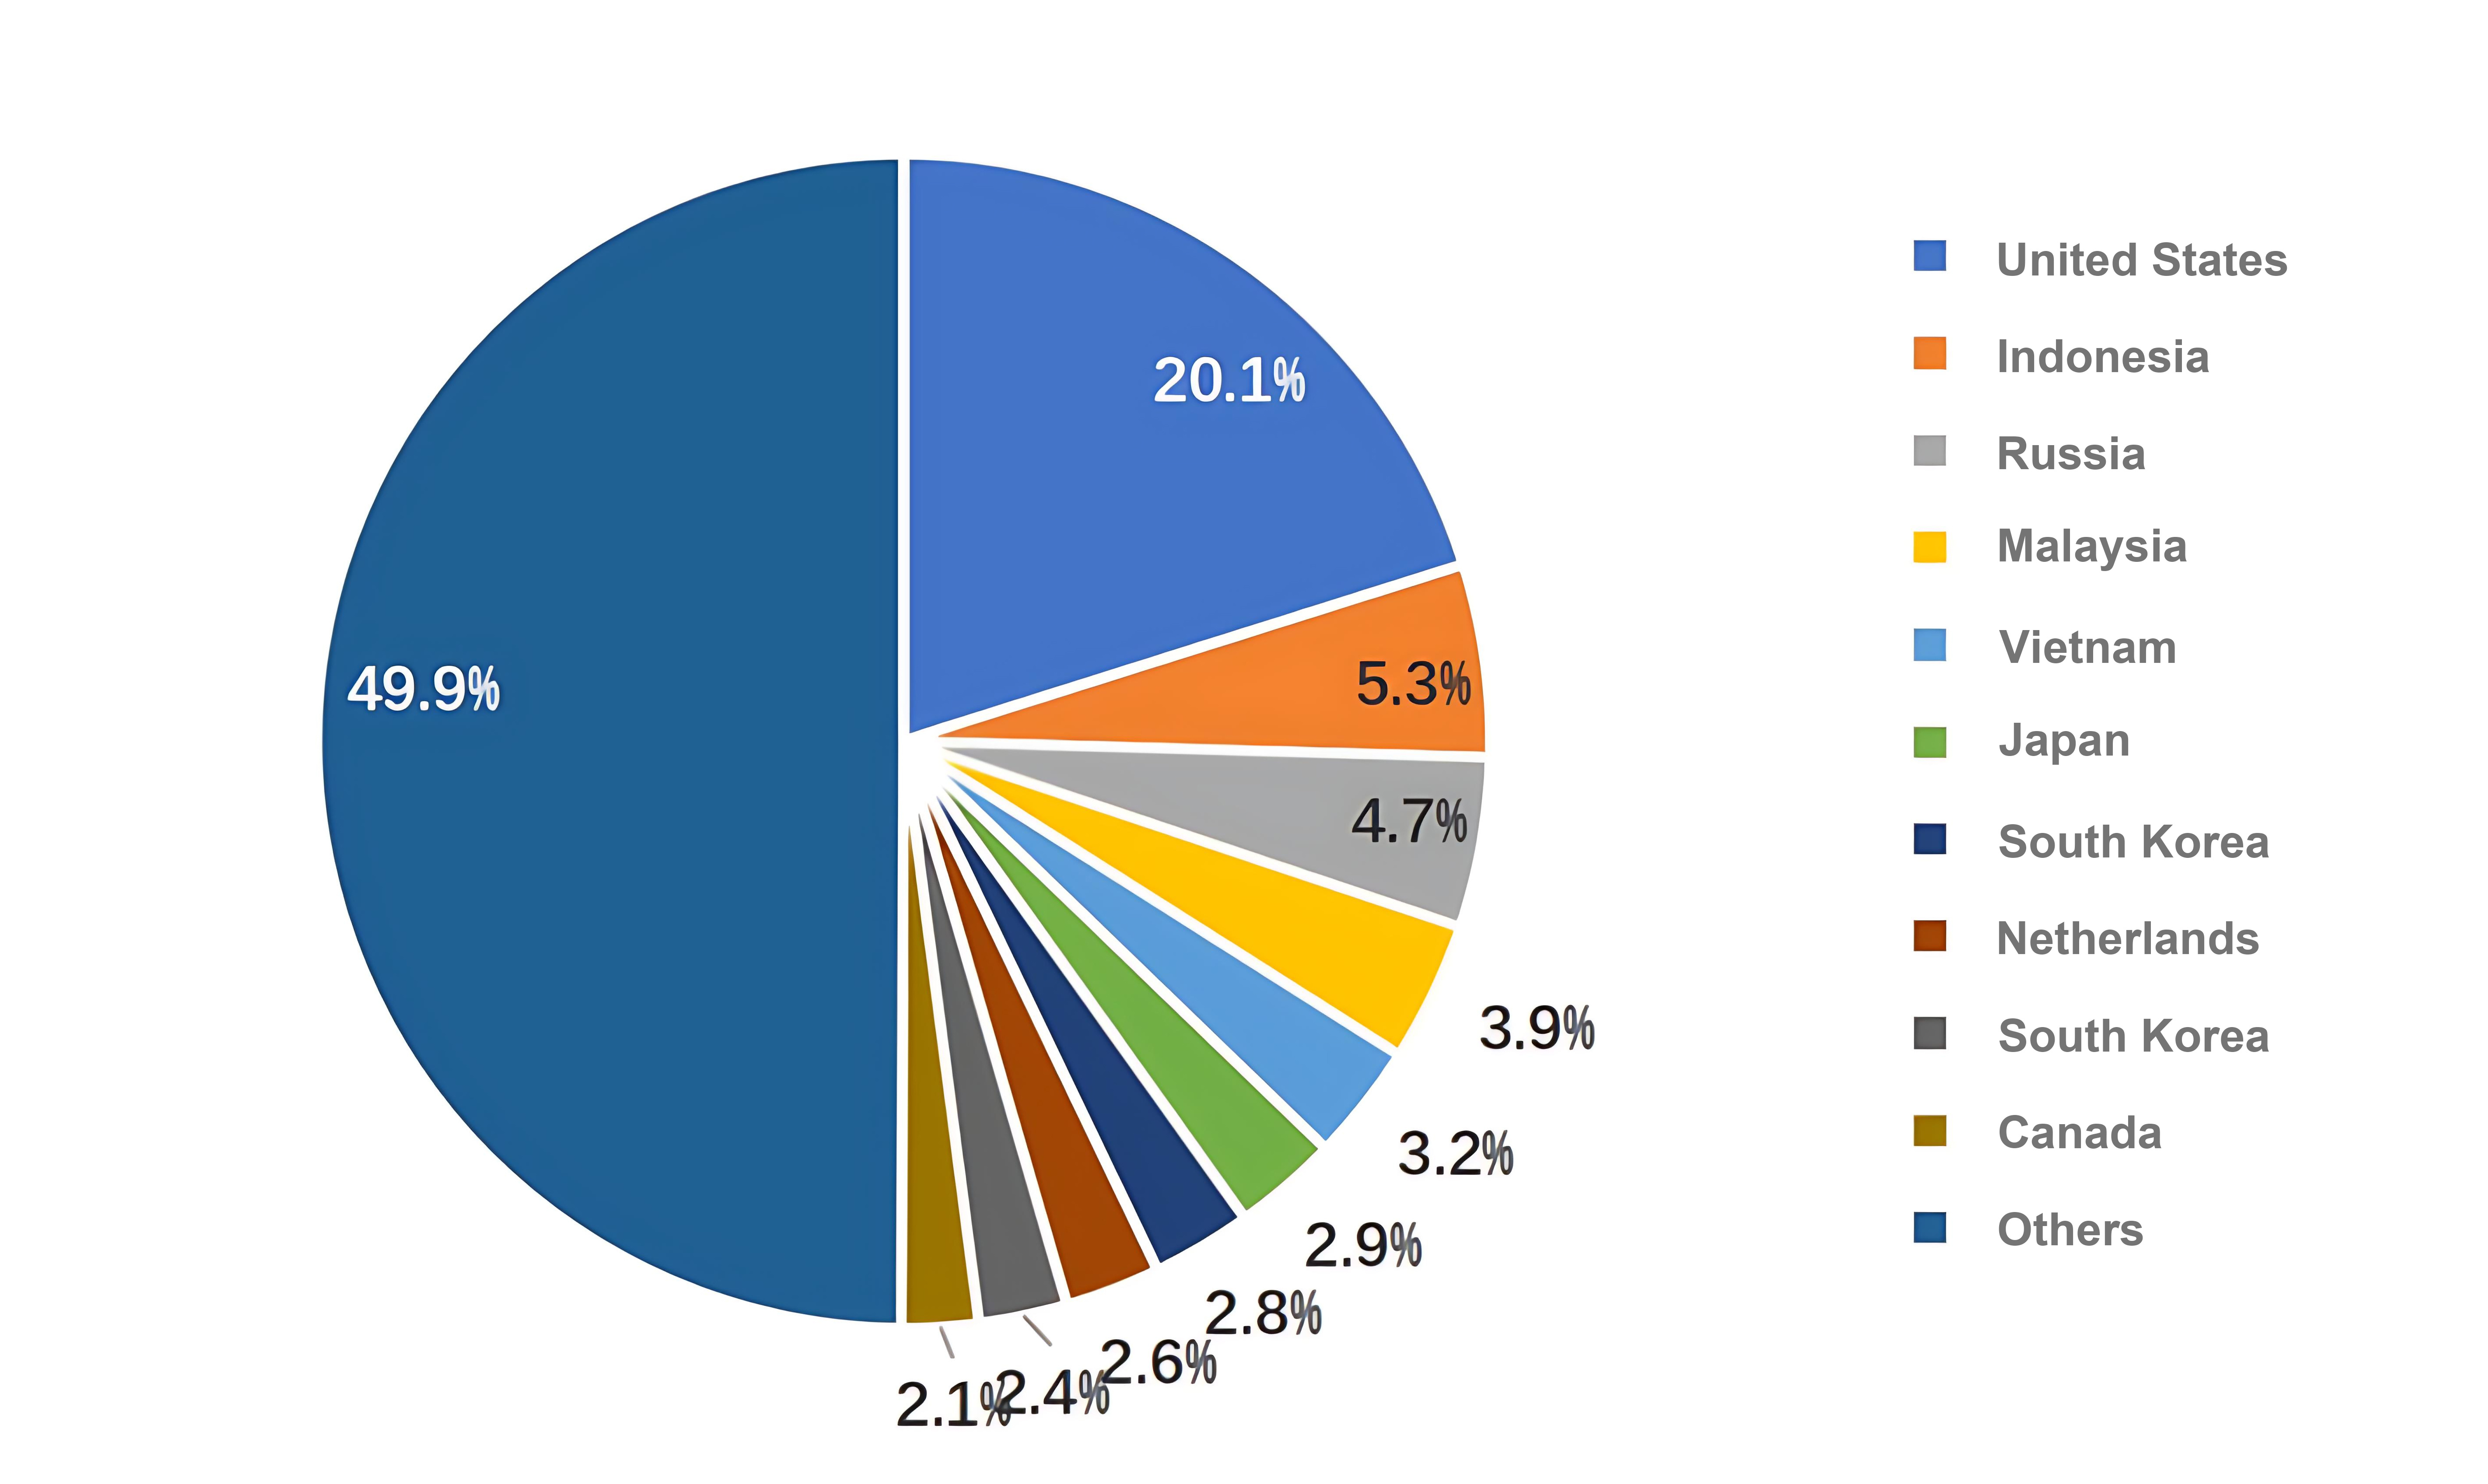
Export Destination Share of China’s Rubber Tires in 2024
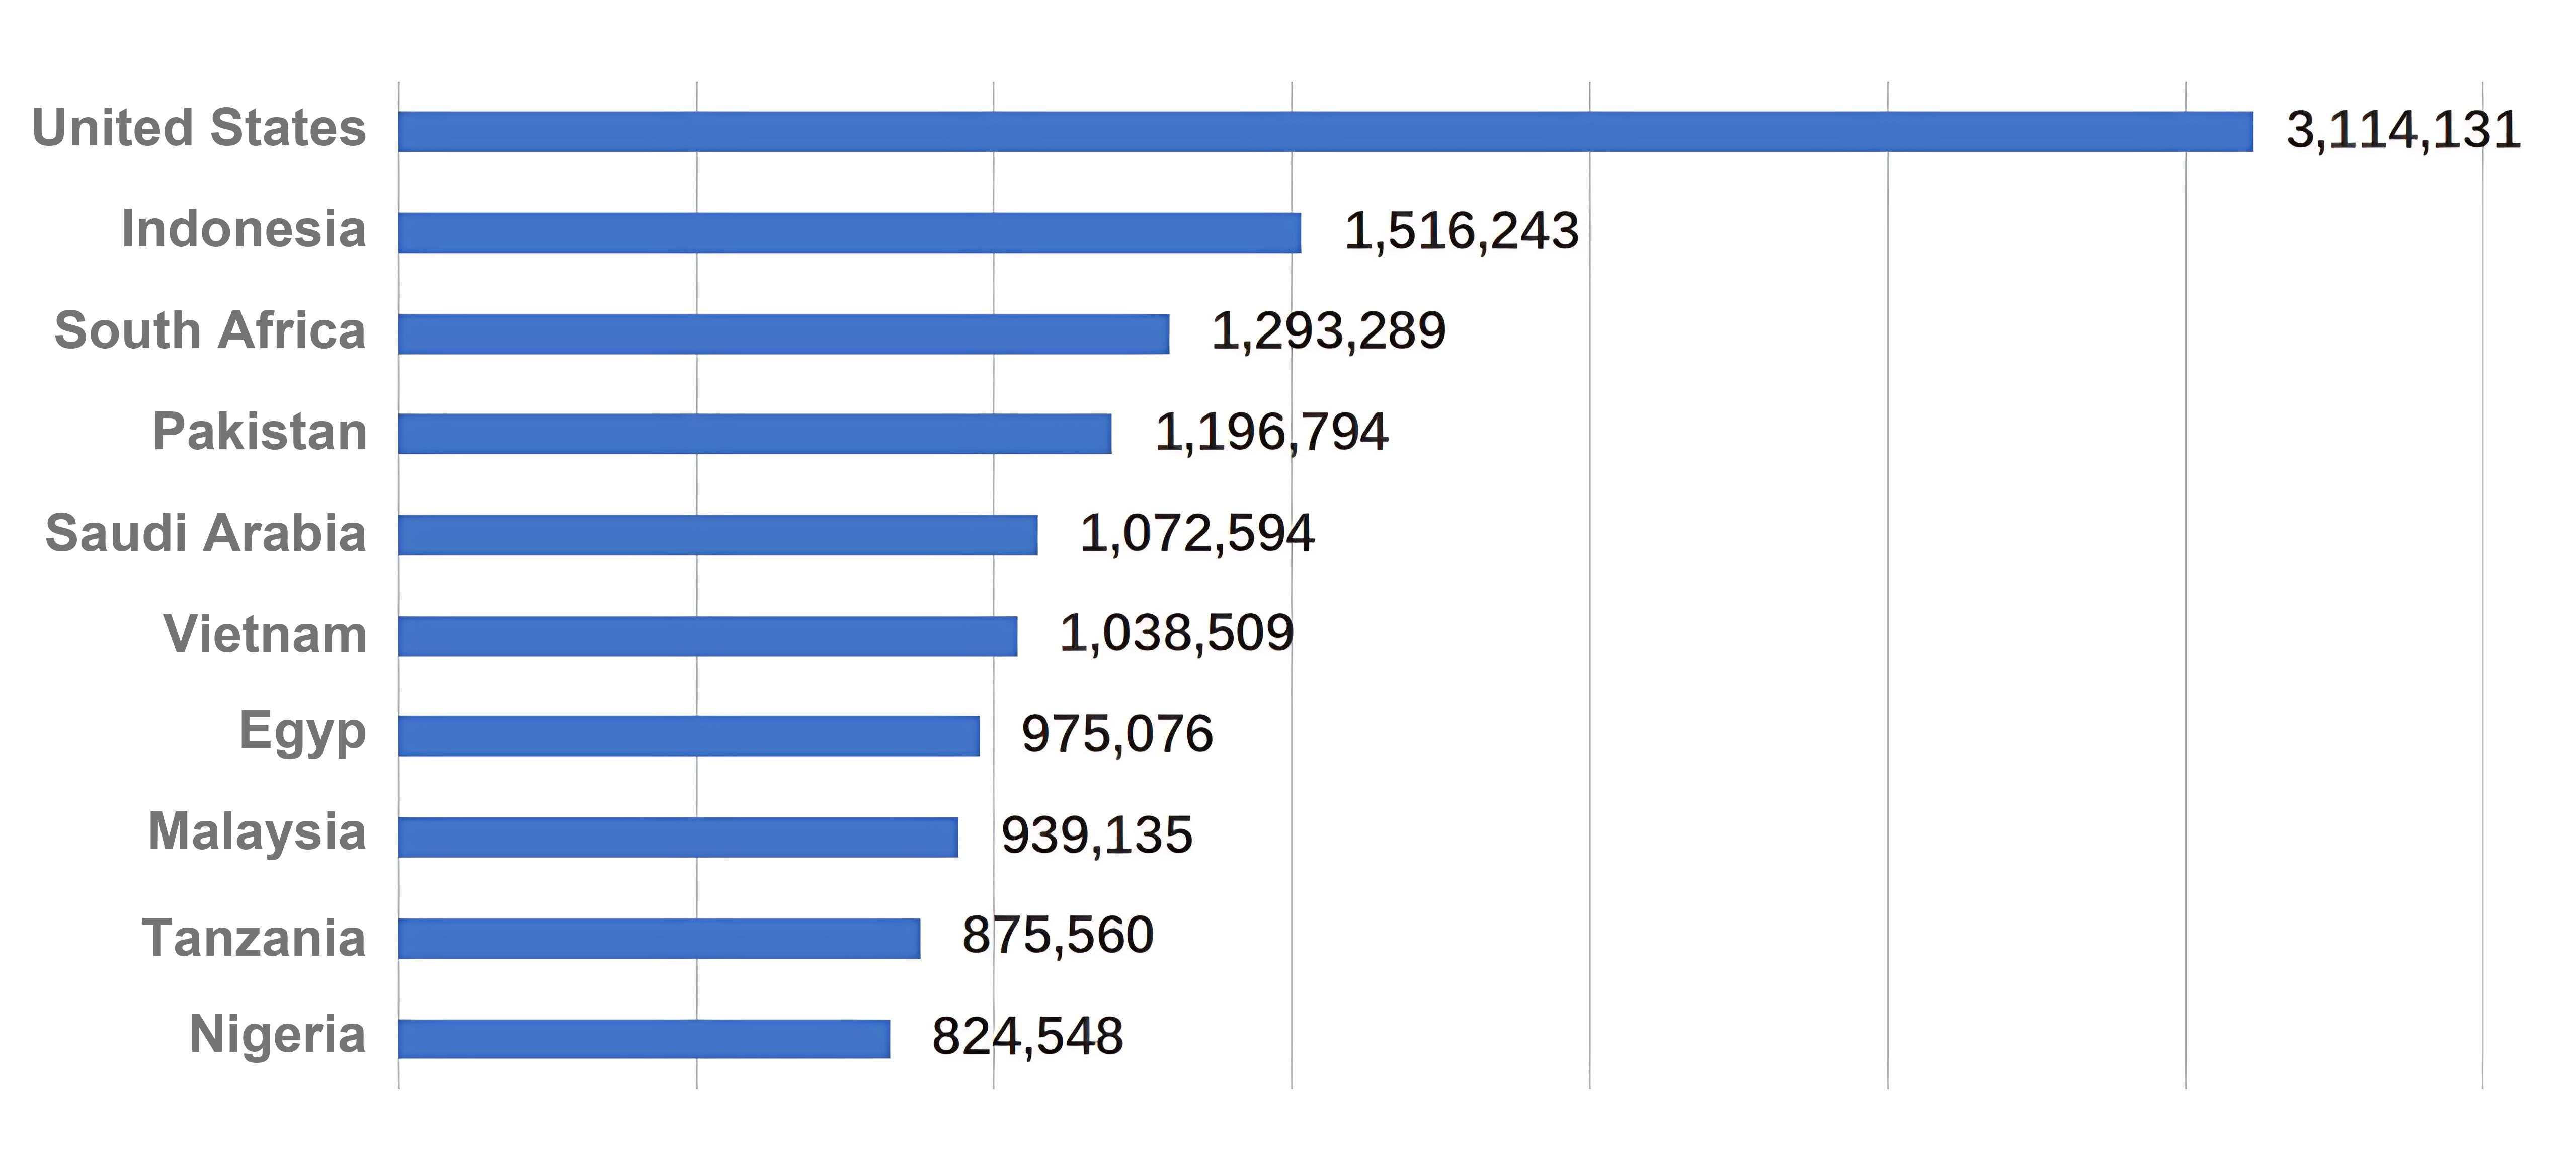
Top 10 Regions by Year-on-Year Export Value Growth of China’s Rubber Tires in 2024 (Unit: USD)
(7) Export Statistics of China’s Brake Friction Pads (HS: 87083010) from 2022 to 2024
1. Changes in Total Trade Value Over the Past Three Years
From 2022 to 2024, the total export value of China’s brake friction pads saw a notable increase in 2024, rising from around USD 1.2 billion in previous years to nearly USD 1.4 billion in 2024. See the chart below for details:
Export Performance of China’s Brake Friction Pads from 2022 to 2024 (Unit: USD Billion)
2. Export Destination Analysis for 2024
In 2024, China’s brake friction pads were primarily exported to the United States, Germany, and Italy, which together accounted for 32.4% of the total export volume. Among the regions with significant export growth, Italy and Germany are particularly noteworthy. See the chart below for details:
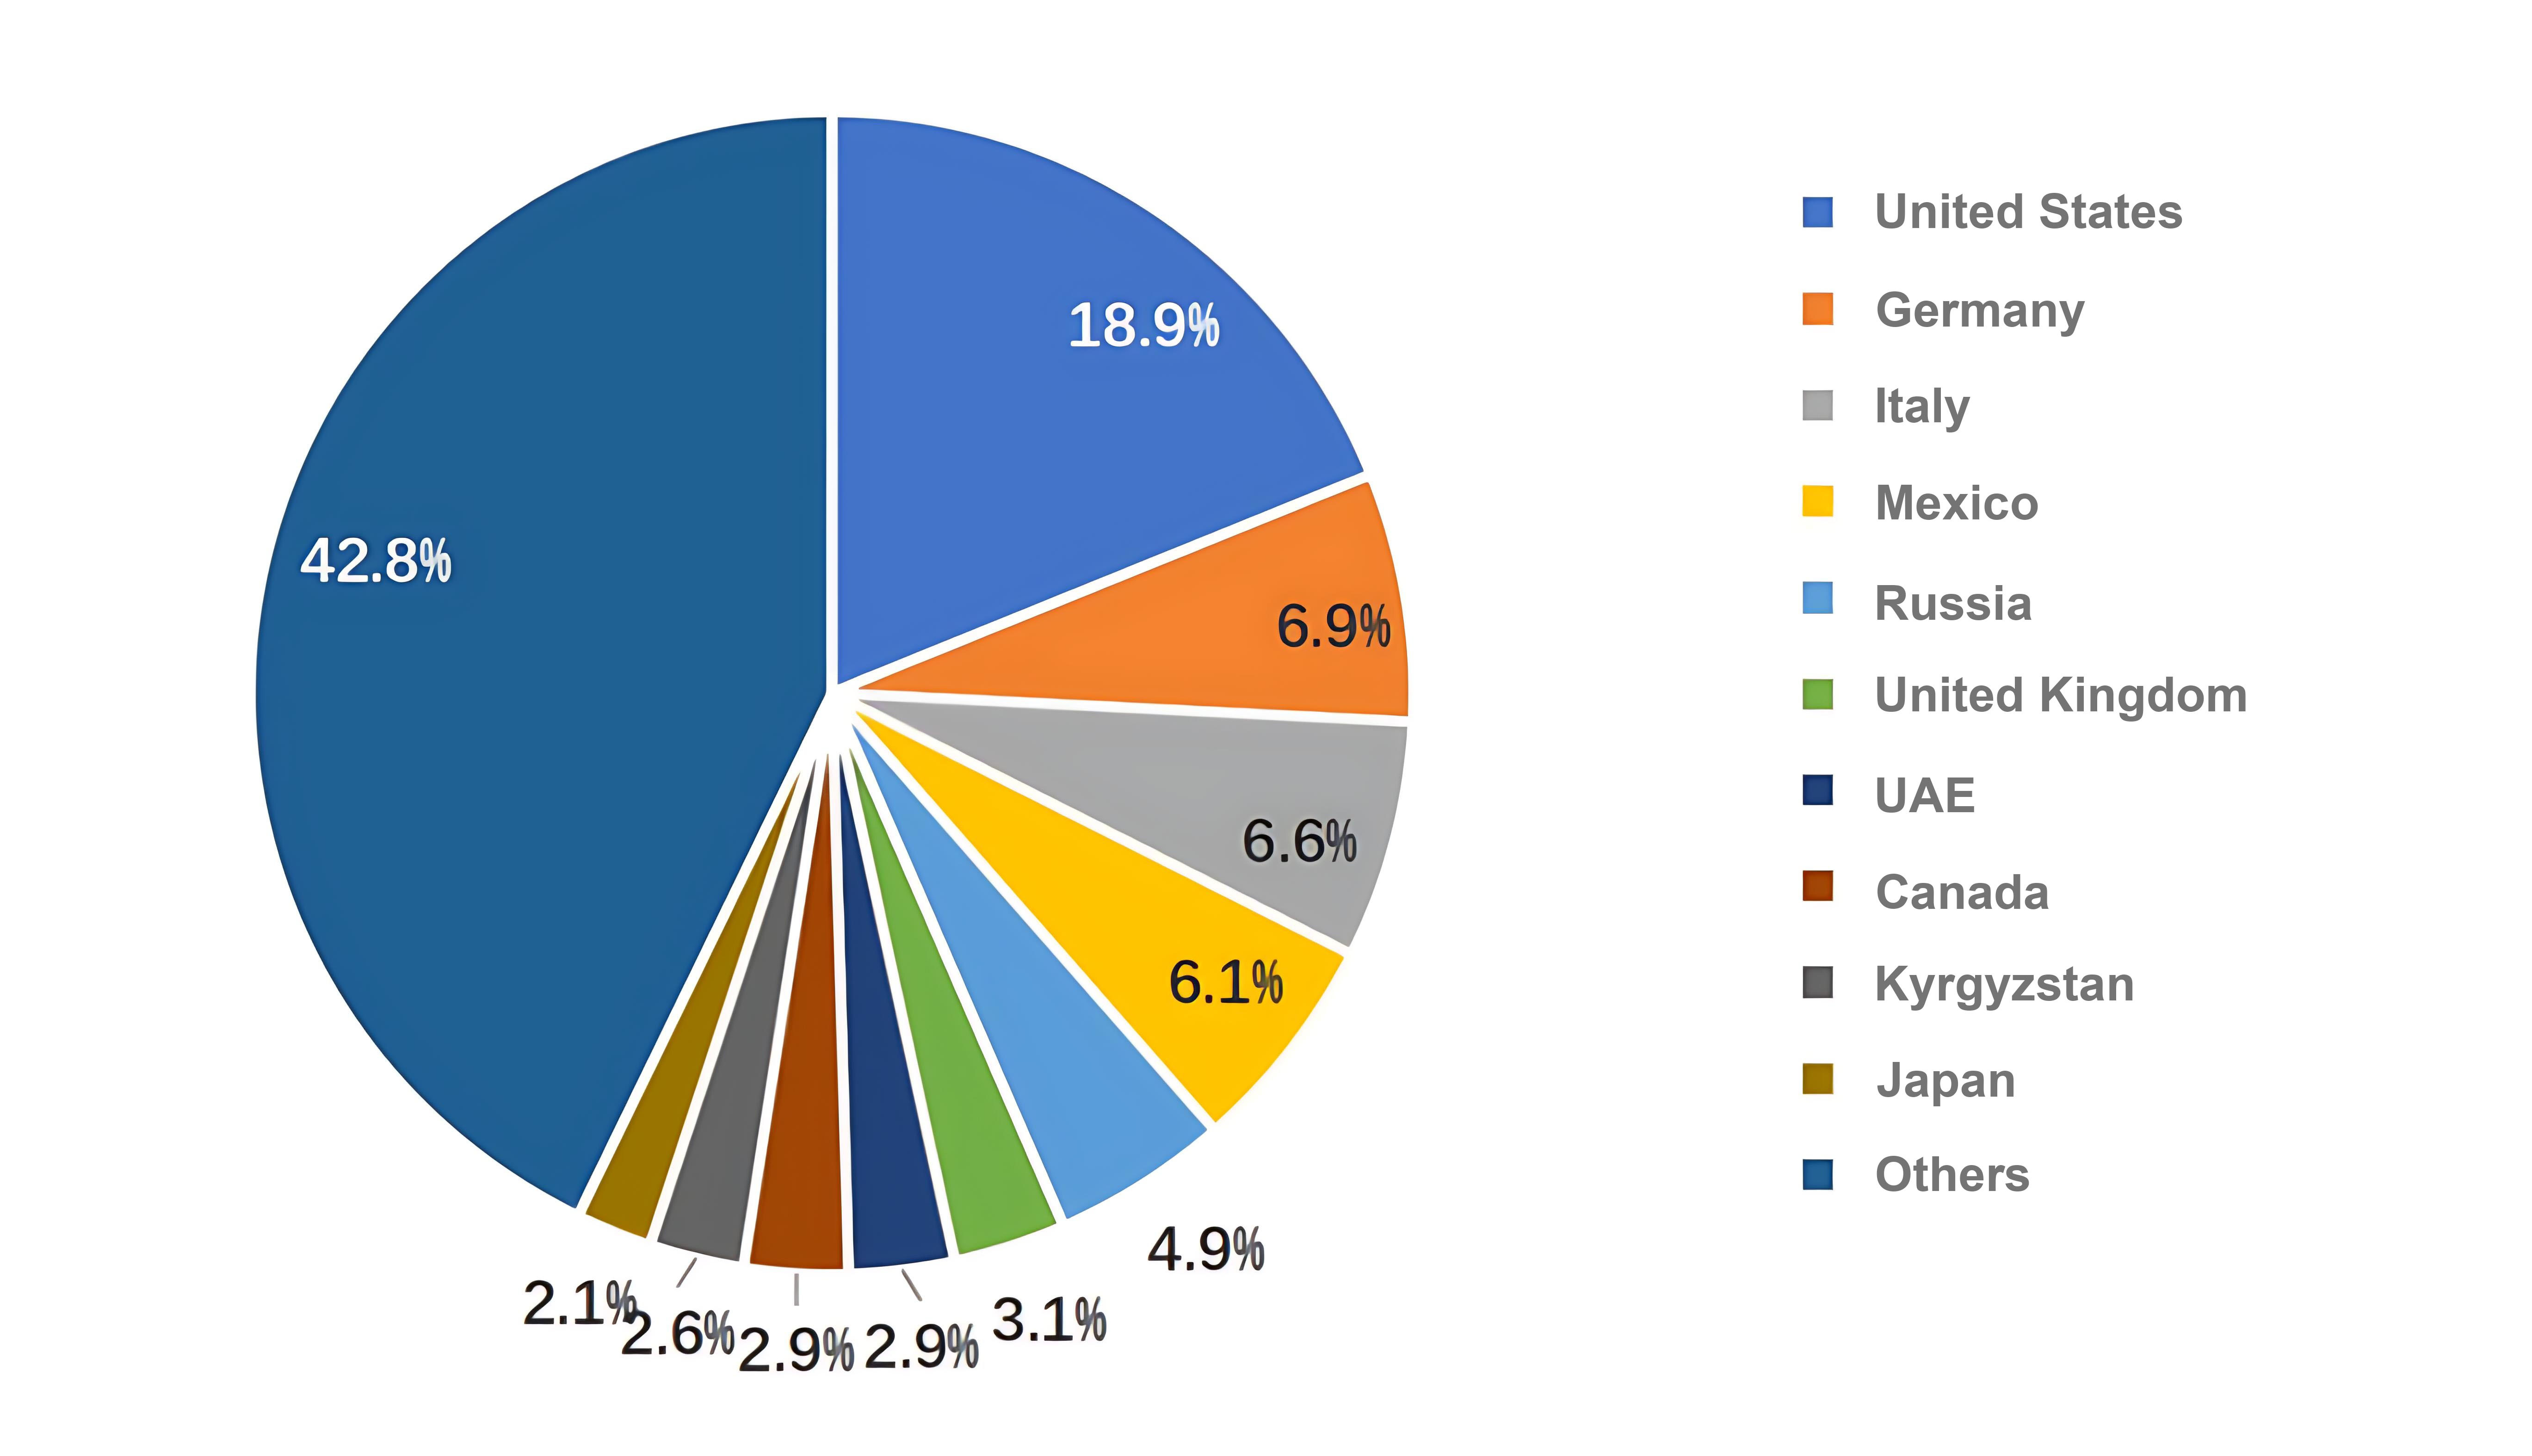
Proportion of China’s Brake Pad Export Destinations by Region in 2024
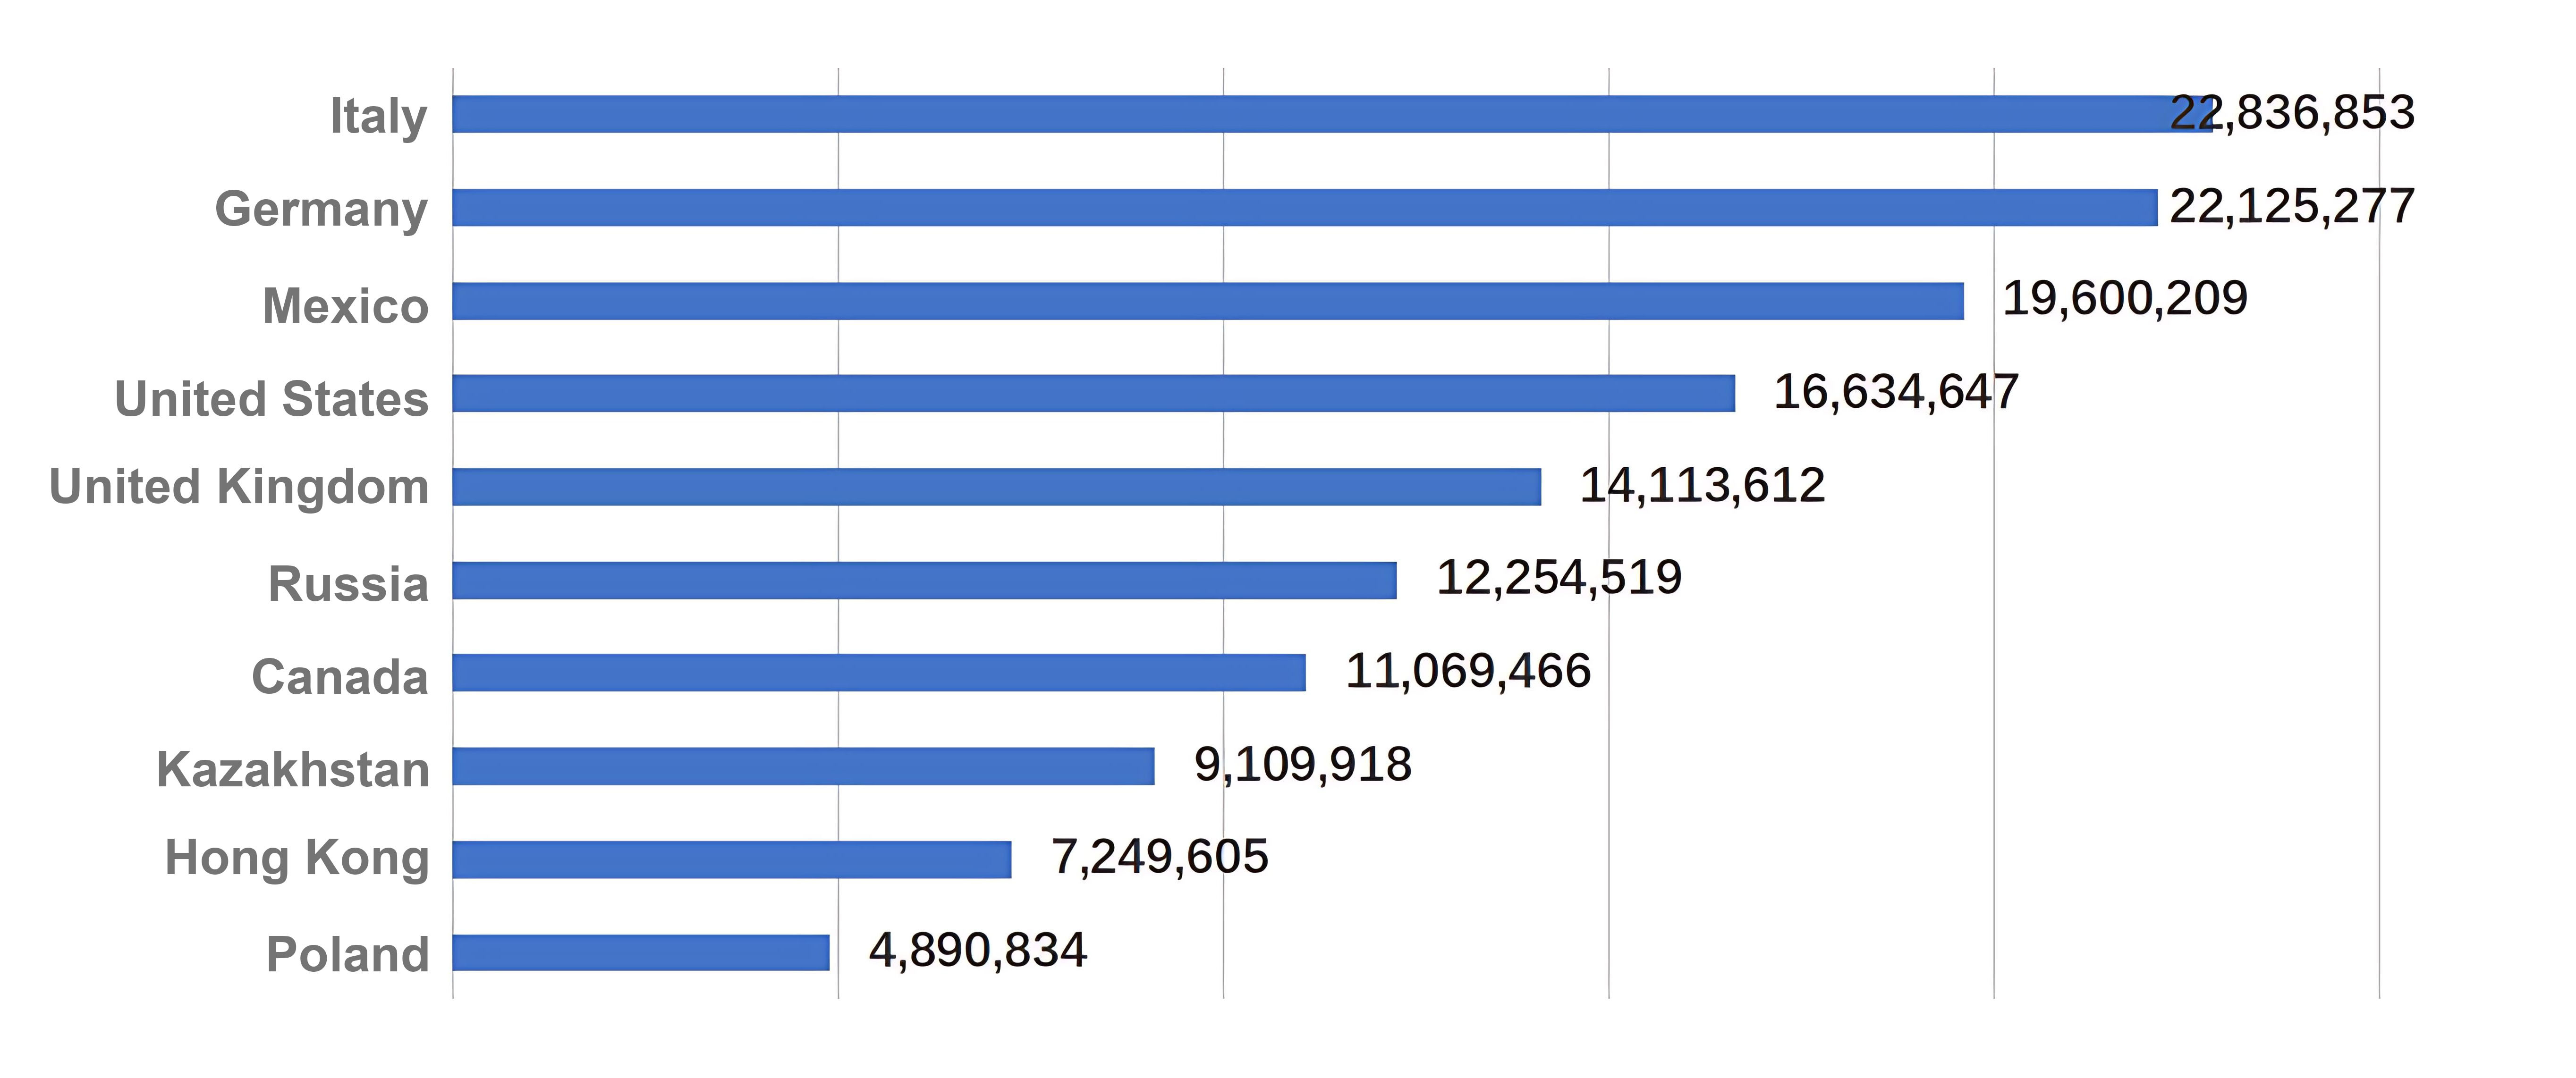
Top 10 Regions by Year-on-Year Increase in China’s Brake Pad Exports in 2024 (Unit: USD)
III. Policy Brief on Major Markets' Regulations Regarding Used Car Imports
3.1 Russia's Vehicle Import Policies
Countdown to Russia’s New Import Regulations:
Starting May 1, 2025, significant changes will be made to the calculation of the EAEU (Eurasian Economic Union) vehicle recycling fee. Exporters should be alert to potential cost increases.
Used Vehicle Import Regulations:
- Emission Standards: Compliance with Euro V emission standards is required.
- Age Restrictions: There is no official vehicle age limit; however, a high import duty is imposed on used cars over 5 years old for individuals and over 7 years old for legal entities.
- Emergency Call System: Installation of the ERA-GLONASS system is mandatory, costing approximately USD 300–400. Right-hand-drive vehicles used in or relocated to the Russian Far East are exempt.
Certification Requirements:
- Vehicles over 3 years old require a Vehicle Structural Safety Certificate (SBKTS).
- Vehicles under 3 years old require Vehicle Type Approval (OTTC).
- Technical Challenges: Widespread public concern exists over incompatibility between the emergency call system and airbags. Retrofitting the system into used vehicles is considered technically difficult.
- Regional Exceptions: Right-hand-drive vehicles operated in the Russian Far East or by residents relocated to the region may be exempt from installing ERA-GLONASS, applicable to:
- Passenger vehicles with up to 8 seats
- Cargo vehicles with a gross weight under 3.5 tons
- Note: For personal use only
3.2 Mexico's Vehicle Import Policies
Mexico has detailed regulations for importing both new and used vehicles:
- New Vehicles: Must comply with NOM safety and emissions standards. Vehicles must pass certification procedures to verify compliance with Mexican regulations.
- Used Vehicles: Strictly regulated to ensure safety and emissions compliance. Vehicles over 10 years old may face additional restrictions or import bans.
3.3 Kazakhstan’s New Vehicle Import Regulations (Effective December 1, 2024)
For Legal Entities:
- New Vehicle Import Restrictions: As of December 1, 2024, only legal entities explicitly listed in the Vehicle Type Approval Certificate (OTTC) are permitted to import vehicles less than 3 years old.
- Used Vehicle Requirements: Vehicles older than 3 years must present a Vehicle Structural Safety Certificate (SBKTS).
For Individuals:
- Annual Import Limit: Individuals are limited to importing one vehicle per year from abroad.
- Certification: Private imports for personal use must be accompanied by a Vehicle Structural Safety Certificate (SBKTS), and commercial use is strictly prohibited.
- Tax Adjustments: Previously, import duties were around 15%.
Under the new regulations, total import taxes for individuals will exceed 42%, including:
- 12% VAT
- 15% import duty
- Recycling fees
- Various additional surcharges
IV. Future Development Trends in the Global Used Car Industry
It is projected that by 2030, global used car sales will exceed 150 million units. Developing markets, especially China, India, Southeast Asia, and Africa, hold significant growth potential.
The used car market is expected to reach a value of USD 460 billion, with a compound annual growth rate (CAGR) of over 10% during the forecast period.
Driven by the expansion of digital sales channels, longer vehicle lifespans, increasing consumer demand for cost-effective automotive options, and the emergence of the used NEV (New Energy Vehicle) segment, the global used car market is poised for continuous growth. Based on forward-looking analysis and market trends, the global market size is projected to reach USD 2.48 trillion by 2029.
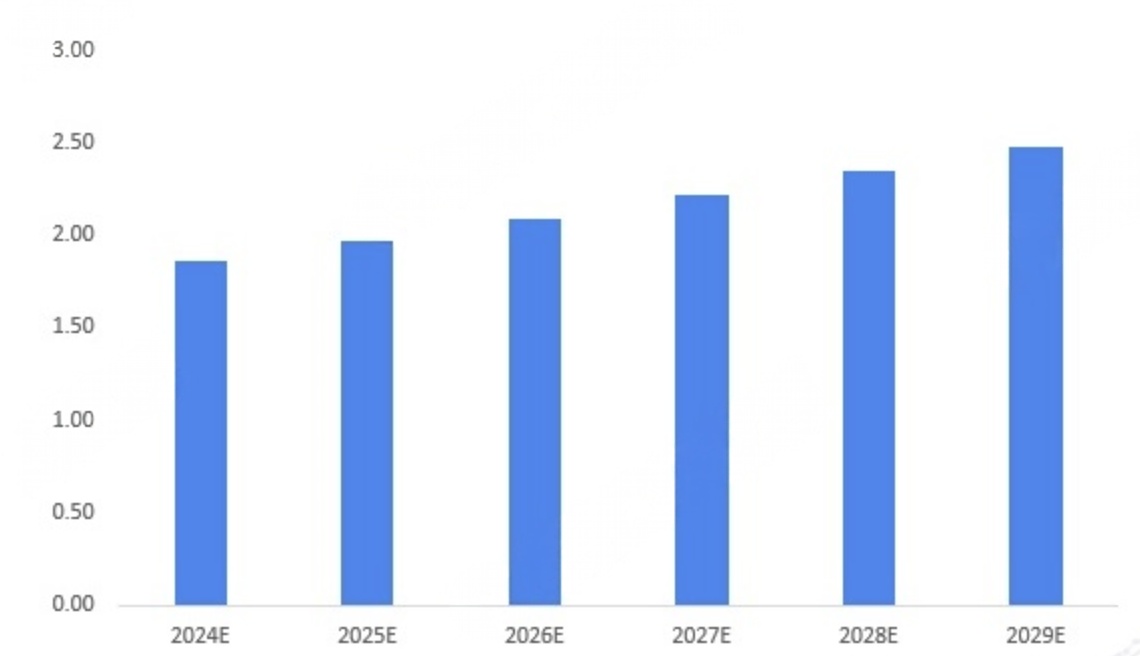
Figure 5: Global Used Car Market Size Forecast, 2024–2029 (Unit: Trillion USD)
In the North American market, the ratio of used car sales to new car sales is nearly 2:1. Many new entrants, such as Fair and Voom, are leveraging artificial intelligence and big data analytics to differentiate their brands and products from traditional used car dealerships. Major original equipment manufacturers (OEMs) are now investing in the used car sector to boost revenue—DONGFENG SOUTH being one example.
Tech-savvy customers aged 25–40 demand end-to-end transactions, home delivery, digital recommendations based on driving behavior and lifestyle, as well as virtual test drives. Market players are offering seamless car specifications, performance reports, and inventory information to empower consumers with informed decision-making.
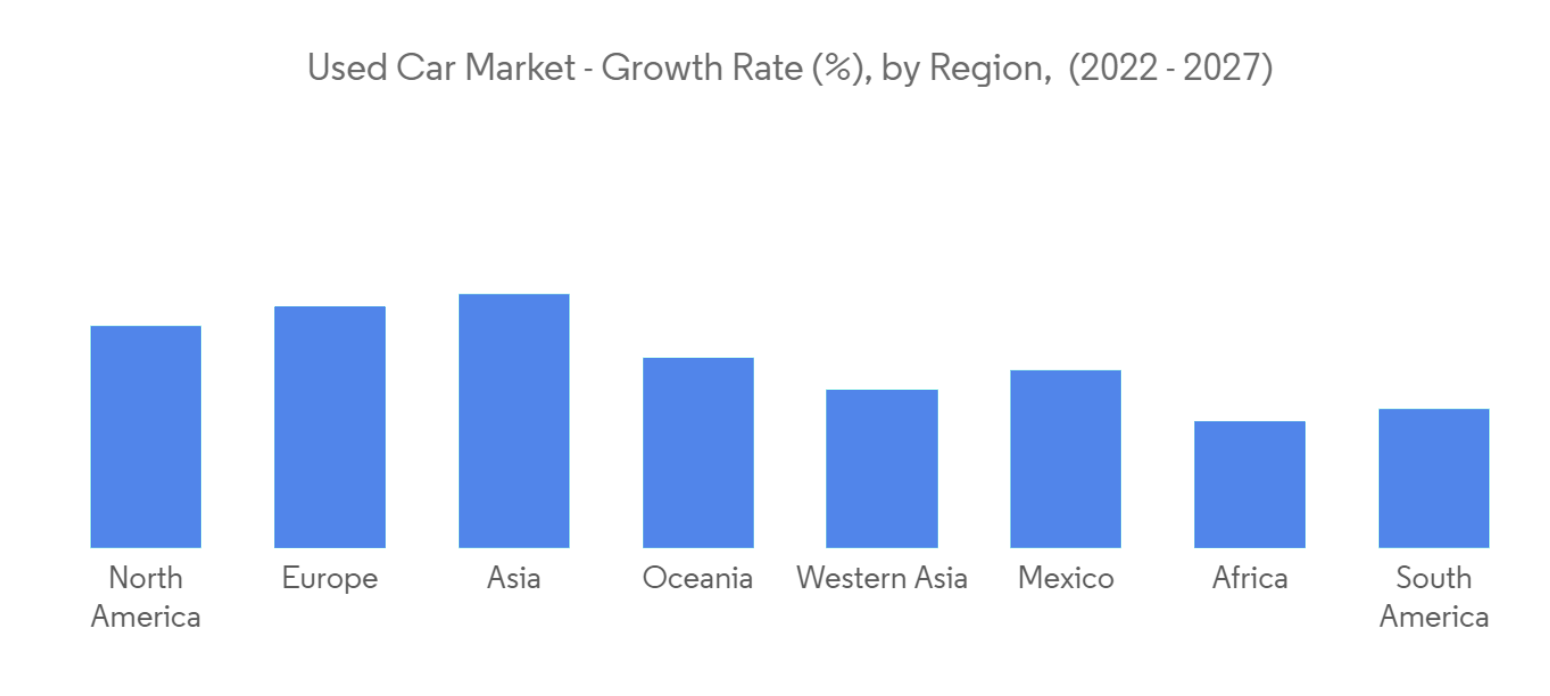
4.1 Asia-Pacific is the Fastest-Growing Market
India is another key market for used cars due to the long vehicle lifespan in the country. In India, affordability is a primary reason for purchasing used vehicles. Most customers are first-time buyers, leading to a strong preference for entry-level hatchbacks.
In Indonesia, approximately 300,000 used cars change hands each month. Given the growth potential of the used car market in Southeast Asia, several major players from other regions are planning to establish operations in Indonesia.
4.2 Market Expansion
Emerging Markets on the Rise:
Southeast Asia is experiencing a compound annual growth rate (CAGR) of 12% in the used car sector. In South America, cross-border e-commerce is driving market momentum—Brazil’s used car imports grew by 40% in 2024. Platforms like Guazi Used Cars are achieving 72-hour delivery in the South American market through a model combining overseas warehouses and local agents. Emerging markets are becoming significant growth drivers for the global used car industry.
Export Growth from China:
China’s used car exports are seeing explosive growth. Going forward, exports will gradually shift towards genuine used vehicles with mileage records, with their share steadily increasing. Emerging markets such as Africa and Central Asia are showing particularly strong demand for used cars.
Consumer Mindset
Rising Acceptance:
Consumer acceptance of used cars has increased significantly, leading to a diversified market with multi-tiered demand. Young consumers are becoming the main driver, focusing on cost-effectiveness and tech features, which is pushing up the share of transactions involving vehicles aged three years or less. In contrast, middle-aged consumers tend to prefer nearly-new vehicles aged 3 to 6 years.
Rising Popularity of Used NEVs:
The rapid adoption of new energy vehicles (NEVs) is boosting the availability of used NEVs. In 2024, NEV market penetration reached 40.9%, driving a 16.8% year-on-year increase in the supply of used NEVs. Vehicles within 3 years of age account for 46.4% of the used NEV market, making them a rising star in the segment.


Contact Us
GM of Overseas Business: Nicole
Overseas Marketing: Ling
Request Quote
We will contact you within one working day. Please pay attention to your email.